
NETWORK GRAPHS 2012
BETWEENNESS CENTRALITY
Cities with a value less than 10 have been removed from the view.
Betweenness Centrality is a measure of how central the given city is. This is determined by calculating the shortest paths between every city and how many of these shortest path connections go through this specific city. Thus determining the importance of the city to the network.

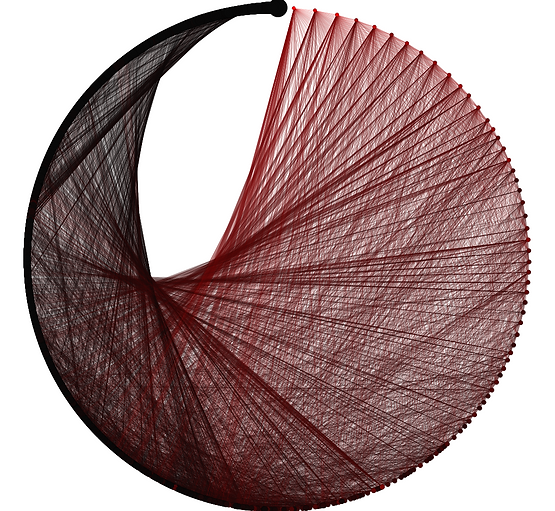
CLOSENESS CENTRALITY
Closeness Centrality measures the cumulative shortest path of the specific city to every other city. In this graph the greater the shortest path is to every other city, the larger the value given to a city as displayed by the place on the graph. The colour change in the connection indicates the number of times the route is traveled (Black to Red).
Concentrations of connections adjacent to each other through the graph are an indication of the more important cities and their clusters found in the graph, Betweenness Centrality. Likewise the concentrations of red connections connecting the first 2/3 of the cirkle graph shows the smaller cities in groups connecting to larger cities across from them in the graph.
DEGREE
Degree is a calculation of how many individual connections are connected to a specific city. In this graph the cities are in order of degree on a circular layout and sized by their degree. Edges are coloured redder the more often they are traversed.
The 9 cities with highest degree

-
Paris
-
Munich
-
Zurich
-
Berlin
-
Hamburg
-
Wien
-
Koebenhavn
-
Frankfurt
-
Budapest
EIGENVECTOR CENTRALITY
Eigenvector Centrality is a measure of influence based upon the connections to other cities and their influence, giving a more accurate measure of influential and important cities.

WEIGHTED DEGREE
Weighted Degree differs from Degree by assigning values to edges based on data instead of assigning every edge a value of 1. Thus possibly indicating cities with fewer connections but containing higher volumes of travelers.
Cities are sized and coloured by weighted degree. Rail connections are coloured by a value most traversed that indicates how many people used that rail connection. The black lines on the last part of the graph indicate a lot of connections between smaller cities with a value of 1.
The 9 cities with highest weighted degree
The number in the Top 9 indicates whether the city has rised in the ranking, falled, if it has stayed in the same place or if is new in the ranking compared to the Top 9 cities with highest degree

-
Zurich +2
-
Munich ~
-
Berlin +1
-
Paris -3
-
Frankfurt +3
-
Basel new
-
Hamburg -2
-
Koeln new
-
Wien -3
DEGREE WITH 99 CITIES
This reduced graph contains only the 99 largest cities by degree, sized and coloured by degree and sorted by weighted degree illustrating the difference between cities with a lot of different connections as opposed to cities receiving larger traffic through less connections.
